Dashboards
_900x339.png)
Capture2Proposal's dynamic reports and dashboards take visualizing your data to a whole new level. With real-time data updates, easy sharing and configuration options, dozens of configuration options, and hundreds of field options, you can get exactly the views you need to share with exactly the audience who needs to see it. Set it and forget it... as long as your team continues to use C2P, your reports will remain in sync and up-to-date!
Dashboards are available for all Licensed Users whose roles allow them visibility to the entire company pipeline of opportunities. Licensed accounts with limited pipeline access, and unlicensed accounts, will not be able to access Dashboards.
C2P Dashboards use the chart portion of reports to build a single comprehensive view. Creating your own Dashboards is easy, but first, you must create Reports in either the pipeline or analytics tabs. To learn more about creating reports, click here.
You can also create new Dashboards using the C2P Out-of-the-Box Reports (OotB) if you'd like to build a Dashboard quickly. You can always go back and customize it more when you're done. C2P also provides OotB Dashboards to give you a head start in visualizing your data.
For video tutorials on Dashboards, click here.
Capture2Proposal has provided the following out-of-the-box Dashboards to our users. These are a great jumping-off point to developing your own customer dashboard views!
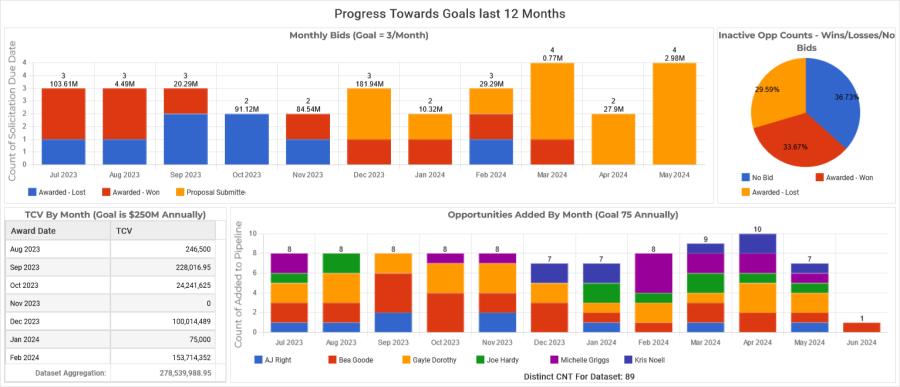
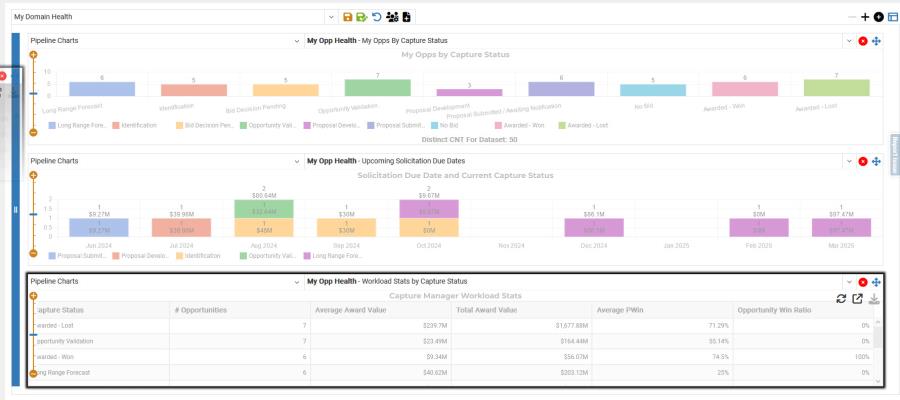
The Pipeline Health Dashboard is a great way to track your pipeline health. Quickly review key performance indicators to ensure your BD efforts remain on track.
Active Opportunity Funnel
This chart shows the total award value of the active opportunities in your pipeline. s there enough money in the top of the funnel to support your goals once No Bid decisions start being made further along in the opportunity development process?
Solicitation Release Date By Capture Status
How many opportunities are being released each month in the upcoming year? What is that Capture Status of each opportunity? Ensure that you are working the right opportunities at the right time, and that nothing is getting forgotten about and left behind.
Solicitation Release by Capture Manager
Are any of your Capture Managers over-committed? What about under-committed? Work out the balance before it's too late!
Contract Vehicle Business Breakdown
How many opportunities are you chasing on each of your vehicles? Which ones are going to be worth recompeting?
Pipeline Win Ratio
How many opportunities do you need to chase to get an acceptable number of wins? Track opportunities you choose not to bid on as well as those you do here to get the most accurate picture.
_900x281.png)
This dashboard is great for looking at your past performance and important upcoming recompetes in your wheelhouse. It uses "Tenant Values" data in award analytics that correlate to your company's UEI(s). If you would like to update the UEI(s) associated with your account, contact support and let them know how you'd like it changed. All of the reports used to build this Dashboard can be found in the C2P Folder in Analytics. Click the charts to drill down on the award analytics for any chart.
Prime Performance (Last 5 Years) Funding By Year
This is a basic snapshot of your prime award funding for the past 5 years.
Top 5 Contract Vehicles by Customer (Last 5 Years)
What is your performance like on your Contract Vehicles? Chase the recompetes on your high-performing vehicles. Consider whether or not the effort is worth it to win a spot on vehicles where you aren't winning many (or any) task orders.
Top 5 Customers (Last 5 Years)
This view shows which customers you've done the most business with over the past 5 years, where you have the strongest relationships to chase more work.
Expiring Contracts (Next 3 Years)
This shows the opportunities you have won that have contract end dates in the next 3 years. Ensure the follow-ons for these opportunities are in your pipeline and that you are actively working to ensure you win the recompete as well.
Potential Task Order Opportunities Based on Past Performance
This is the counterpart to the Expiring Contracts chart: This chart shows expiring task orders on your contract vehicles and in your wheelhouse (i.e., with customers, PSCs, and Set-Asides that you use) that are not always your awards. This shows the money out there, and the areas where you could be gaining market share with work to win this business away at the time of the recompete.
Top 5 Customer Offices (Last 5 Years)
This is a more detailed view that correlates with the Top 5 Customers chart shown above it. Which customer offices you have supported the most in the past five years? This is the best look at where your team has formed relationships that may help win future work.
Building or customizing dashboards in C2P is quick and easy! Tailor dashboard content to each of your reporting needs. Start from scratch, build a new dashboard off of an existing one, or edit a detail to improve a dashboard you already own. It's all possible in C2P.
- The upper left-hand corner of the Dashboard page has the familiar C2P component management tools that are also see in reports on the Pipeline and Analytics page.
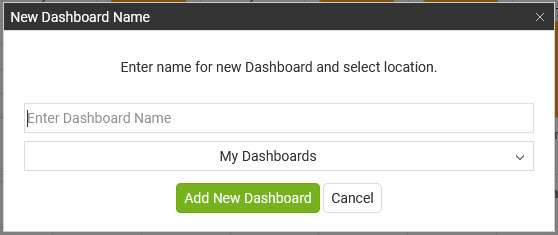
- To build a new dashboard, select the "Build New" icon in the menu, and enter a name for the new Dashboard.
- Enter a name
- The default is to add to the My Dashboard (personal) section. You may choose to build in the Shared Dashboards, or within a Report Group in the dropdown.
- Click "Add New Dashboard" to save and open the edit view.
- To build a new dashboard, select the "Build New" icon in the menu, and enter a name for the new Dashboard.
- You will open to a blank dashboard with one large empty chart portion taking up the whole screen. There are four areas of the page you should familiarize yourself with at this point.
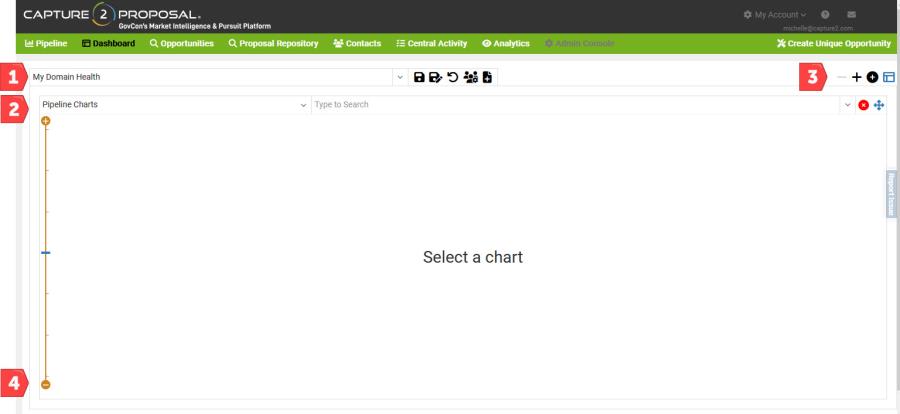
- First is the component manager section. This will show you which dashboard you're in, and give you the option to save while building the dashboard.
- Second is the chart view pane. In the top left corner of the pane is a dropdown to select the report used in the chart.
- You can select from either Pipeline or Award/Analytics reports.
- The second dropdown, for the report name, will populate based on the report section you select.
- Third are the controls for the dashboard size and edit mode.
- The first two icons, - + , control the size of the dashboard.
- The default is to match the screen height and width available. If you wish to have a larger dashboard to make it easier to see certain elements, you can increase the size. This will introduce a scrollbar on the page.
- The next icon, the plus within a dark circle, is used to add another report to the view.
- The final icon toggles between edit view and normal view for the dashboard.
- The first two icons, - + , control the size of the dashboard.
- The fourth controls allow you to adjust the size of a chart within the page. Clicking the plus or minus on the ends of the bar will change the length of the chart in that direction. An additional control will show for the page width when two elements are placed side by side.
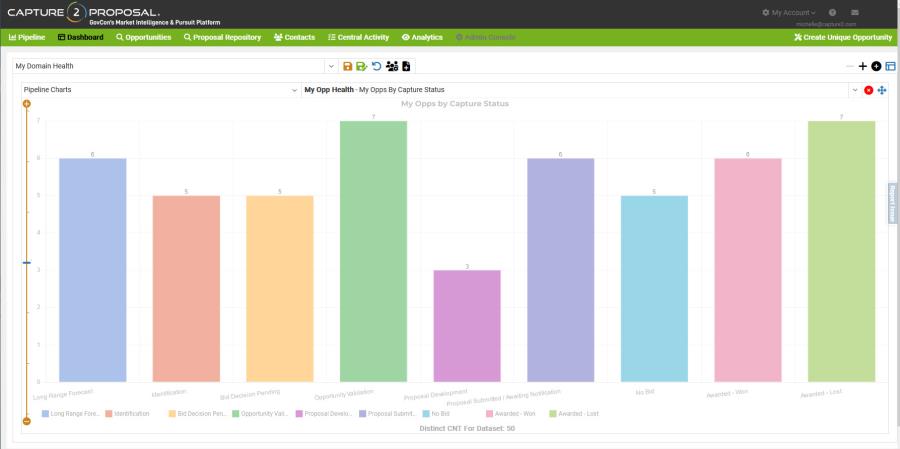
- Select a report from the dropdown in location 2 above. You will only see the chart portion of the report here. You can select from the C2P OotB content if you wish.
- The chart will now show in the center of the page. It will look faded, indicating that you are still in edit mode.
- To the right of the chart name you will now see two new icons while in edit mode.
- The X in the red circle will delete the chart view from the dashboard. It will not delete the chart/report from your account.
- The icon with four arrows is the move chart icon. It will allow you to drag and drop the chart to a new location on the page. This can be done as soon as two or more charts have been added to the dashboard.
- The chart will now show in the center of the page. It will look faded, indicating that you are still in edit mode.
- Click the add chart button to add one or more additional charts to the page. Each will show underneath the charts already on the page.
- To move a chart to a new location on the dashboard, click and hold the "move chart" icon. As you drag it around the screen, blue bars will show in the locations where you can move the chart, generally to the right, left, above, or below, any existing chart on the page.
- Release the mouse button when the appropriate bar is visible on the screen to move the chart to that location. Note that when moving to side of existing objects you will have the option to go the whole page length, as shown below, or the height of any of the rows within the dashboard.
- Release the mouse button when the appropriate bar is visible on the screen to move the chart to that location. Note that when moving to side of existing objects you will have the option to go the whole page length, as shown below, or the height of any of the rows within the dashboard.
- When you have added all of the chart elements you wish, and moved them to the locations you prefer, you can save the chart in the C2P component management tool by clicking on the orange floppy disk for Save, or the green floppy disk to Save As a new dashboard.
- After saving, toggle the edit mode icon in the upper right corner to see the normal page view.
- If you toggle out of edit mode without saving, you will be prompted with the option to save your dashboard as well.
It is possible to open a report directly from the dashboard to view the full data set. Users with create/update permissions on the dashboard and report can also update the report and view the changes in the dashboard once complete.
- Roll over any chart element within a Dashboard. Three icons will appear in the upper right-hand corner of the window. This works in both edit and view modes.
- The first icon is the refresh icon (Reload This Chart), and works the same way as the refresh on the Pipeline page.
- If the chart, it's associated report, or an opportunity used to help build the report, is edited while this page remains open, then click the refresh icon. The data/view of the chart will update to the current saved version.
- The second icon will have a rollover that either save "Edit Report" or "View Report."
- If it says Edit Report, you will have the option to save changes to the report that will update the dashboard.
- If it says View Report you do not have permissions to edit either the Dashboard or the Report (or both). You can still open the report and use "Save As" to save a new version of the report. Depending on your location in the application, you may also have the ability to use Save or Save As to save updates to the Dashboard, or create a new one. To learn more about saving options in C2P, click here.
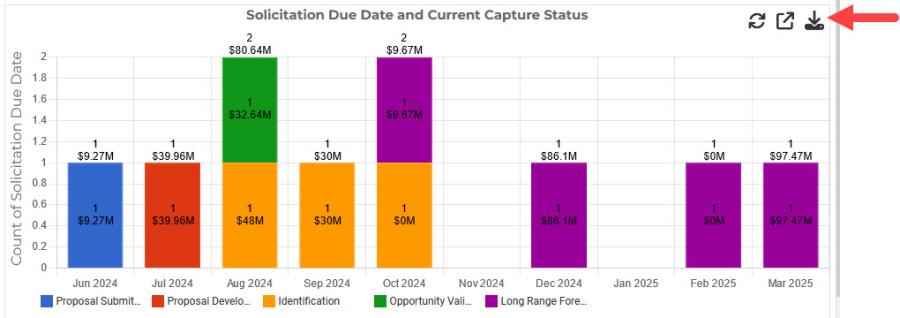
- The third icon will allow you to download the chart as a PNG file.
- The first icon is the refresh icon (Reload This Chart), and works the same way as the refresh on the Pipeline page.
- Click the middle icon and the full report will open in a new tab.
- Edit the report and save.
- If you are working from a dashboard in the Dashboard tab (not a dashboard within organization profiles or Opportunity SONAR):
- If you use the normal "Save" you are done; the changes will be made in the dashboard as well. You may need to refresh the view to see them.
- If you use "Save As" the dashboard should update to show the chart came from the new report. However, you will need to save the Dashboard to apply the change.
- If you do not have Save permissions on the Dashboard, you will need to use "Save As" to save a new version of the Dashboard.
- If you are working from a dashboard in the Dashboard tab (not a dashboard within organization profiles or Opportunity SONAR):
- Edit the report and save.
The Dashboard feature is only available to licensed users with access to the full company pipeline. Share and edit permissions are also limited, although they can be given to users on a case-by-case basis with the Dashboard view.
The following roles have full CRUD permissions in the Dashboard view:
- Business Manager
- Business Manager - Admin
The following roles can Create and Share Dashboards, but do not have edit or delete permissions on Shared Dashboards that they do not own:
- Business Developer I
- Business Developer II
- Executive Oversight
A BD Manager, or the Dashboard owner can change the access on a specific Dashboard with the following steps:
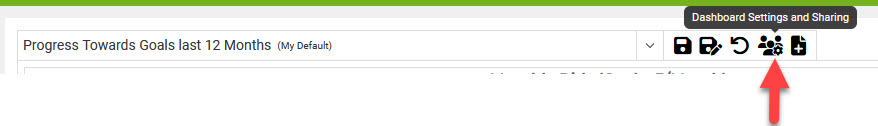
- In the Component Manager pane, click on the icon with the rollover text "Dashboard Settings and Sharing"
- Go to the drop-down "Share With" and select the appropriate option.
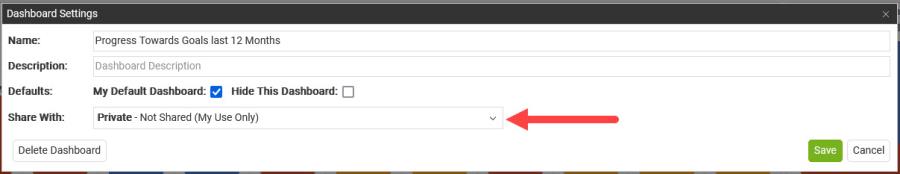
- Private - Not Shared (My Use Only) will not allow anyone else to see the Dashboard.
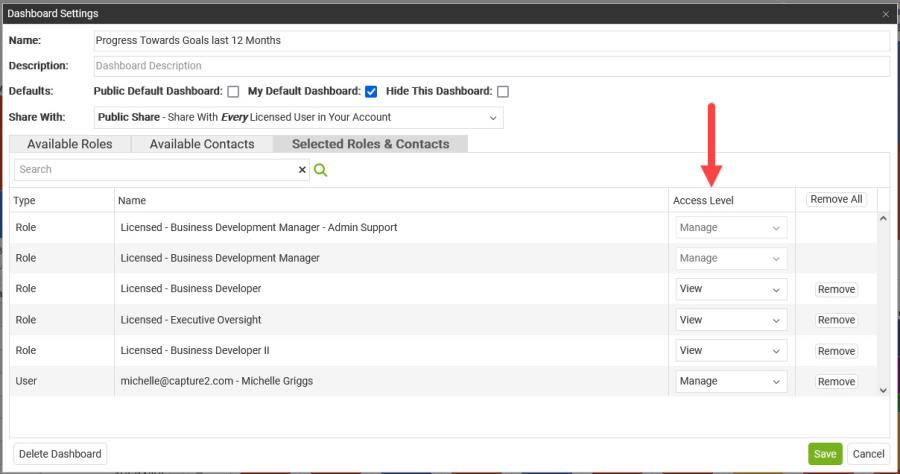
- Public Share - Share With Every Licensed User in Your Account will share with all user roles who have access to the Dashboard Feature.
- Targeted Share - Share With Specific Licensed Users and/or Roles will allow you to select who sees the Dashboard either by name or role. Note that the two manager-level roles will always have access to all shared Dashboards.
- Selecting a user who does not have access to the Dashboard feature will not grant them access to view the Dashboard.
- Both the Public and Targeted Share options will give you the ability to select whether another user has View or Manage-level permissions for the shared Dashboard. You will only be allowed to edit the permissions for non-Manager roles and individual users.
- Save your changes for the new permissions to take effect.
Users will have different favorite dashboards based on their needs, but here are some ideas for easy to build dashboards that have widespread value.
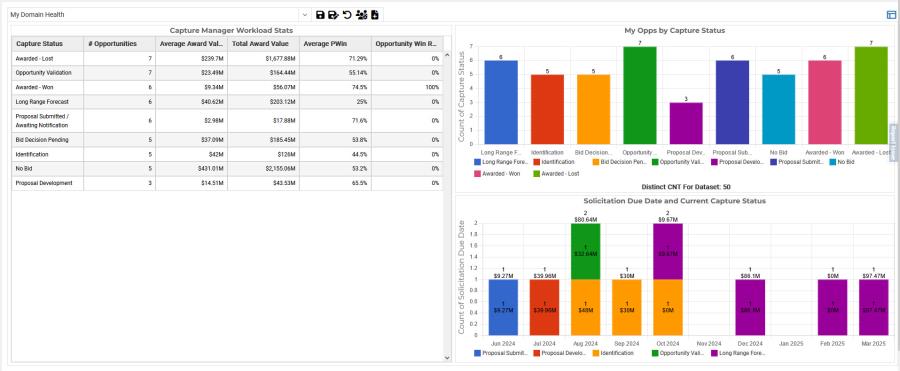
- Individual Capture Manager Dashboard - Create a report using C2P's Capture Manager Report, but customize it to just your opportunities for a quick snapshot of where things stand. This is a great way to see when you're going to be overworked, and when you might have a lull! It's also a great way to ensure you're updating Capture Statuses appropriately based on the planned Solicitation dates for each opportunity.
- Contract Vehicle Performance with Award Analytics - Track your performance on each of your contract vehicles using the Pipeline Contract Vehicle Reports. Build some reports in Award Analytics to compare your performance to the vehicle(s) overall performance.
- Goals-Based Dashboards - Track how many opportunities your team is bidding each month, your win percentage, TCV, and more in one place. Tracking these stats monthly will make it easy to see if you're on track to hit your annual targets.