Reports (Internal)
Reports are used to organize and access the data in your pipeline, and on the funded analytics page.
There are three types of reports:
- My Reports: Reports that belong to you that are not shared with anyone else in your tenant.
- Shared Reports: Reports that are shared to multiple people in your tenant. When a shared report is updated, everyone with access to the report sees the update.
- C2P Reports: Reports designed and provided by the Capture2Proposal analytics team. These reports will be shared automatically with all authorized users when they are designed for the Pipeline, and will be available on request when designed for the Funded Analytics page.
Pipeline and Analytics reports are made up of up to three key elements: a data filter, a display setting, and a chart. When you save a report, the settings for each of these elements is saved within the report settings, and will be applied when the report is opened again.
Here are a few short training videos on reports and report elements.
Building a report is as easy as pulling up the data you want to see on the screen and saving when you have everything the way you want it. You can customize the data filters, grid elements, and chart elements, and all will be saved simultaneously into the report. You don't need to customize all three areas, but whatever you do have visible on the screen when you hit save is what will be saved.
First, click the icon to create a new report. The icon is visible in the report controller box, as well as in each section of the dropdown where you have permissions to build a report.

Or, a great shortcut is to open a report with a grid view and/or a chart you want to reuse, then to use "Save As" to save those elements with a new data filter that works for the report you want to build.

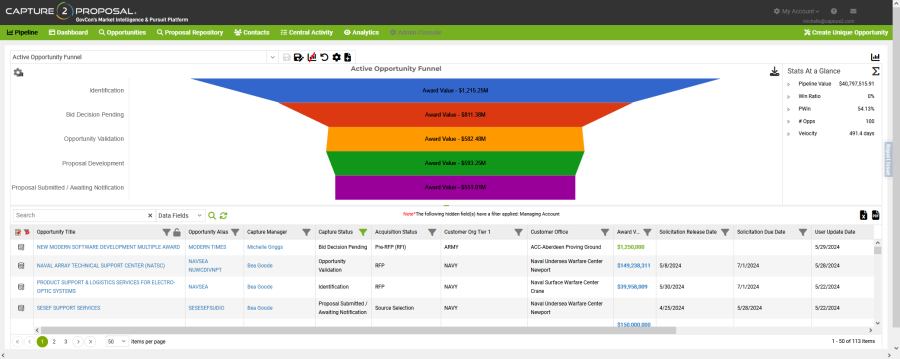
The data filters are any filters you apply to the data in the grid portion of the page. These filters are shown in either of two ways:
- If the column is visible on the page, the filter icon will be green to indicate a filter has been applied and saved. The filter icon will be orange if a filter was applied but has not been saved in the report, and gray if no filters have been applied to the data.
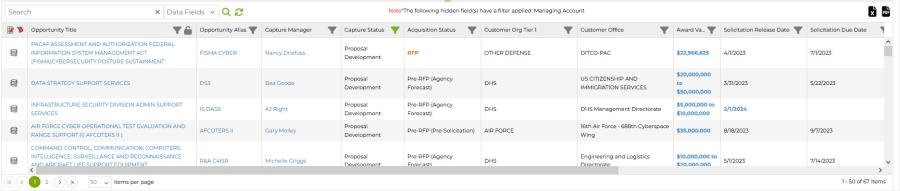
- If a filter was applied to a column not currently visible on the page, a message will appear above the grid letting you know that the data has been filtered on a given element.
The grid view is defined as the columns visible in the grid display. On the Pipeline page, most Capture2Proposal and Custom Capture data elements can be shown in the grid view, so the combinations for which elements to display, and in what order, are virtually limitless. For the Funded Awards, options are more limited.
For the Grid in Pipeline:
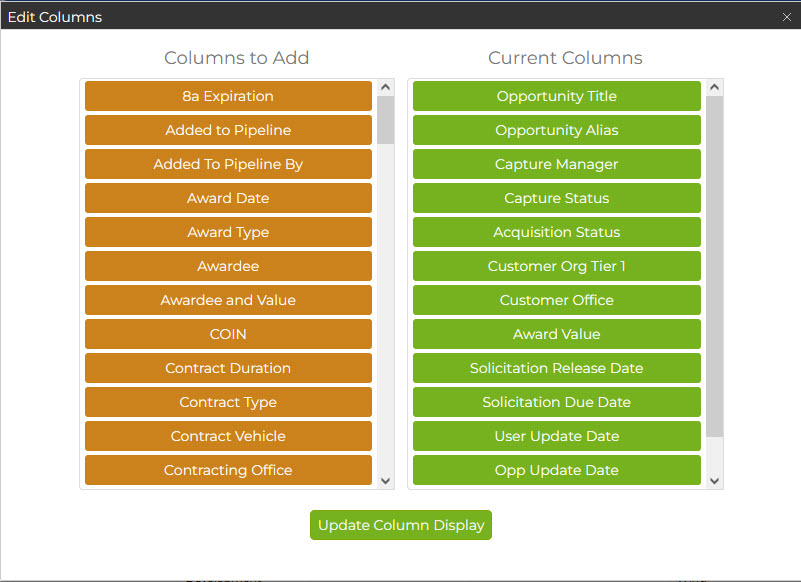
- Select which columns to display using the grid editor icon in the top left corner of the grid to display all possible options.
- Options will display in an alphabetical list of all Capture2Proposal standard elements in green, then of all custom capture elements in blue.
- Drag and drop elements between the columns on the left, representing all unused elements, and the right, representing those in the view. You can also drag and drop elements on the right up and down to change the display order.
- Edit the columns further within the grid:
- Drag and drop columns to change their order.
- Resize columns by dragging at the edge of two columns.
- Lock one or more columns on the left side of the screen to keep them visible even if you scroll right to see additional data.
For the Grid in Funded Analytics:
You cannot change the column order or add custom options to the display, but you can still do the following:
- Resize columns by dragging at the edge of two columns.
- Expand or collapse the view of contractor attribute columns by clicking the blue arrows in the Contractor Column.
Select from a favorite graph to add it to the report, or build a new chart from scratch. Go to Chart Building 101 for all the information on how to complete these actions.
Before saving your report, check that the name in the report element box matches what you want for the report. If you are editing an existing report, this should be the case. If not, use the "Save As" icon to create a new report with a new name.
Sharing reports is done from the report settings window. You can choose to share a report any time you have the "Sharable Report" icon.
There are two different icons for report settings. Which one you see will depend on your permissions regarding the report. The options available in the settings will also differ depending on the report type.
 This icon indicates a Locked Report. You can access the report, but you cannot share it without saving it as a new report first.
 This icon represents a Sharable Report. You have permissions to edit and/or share this report with other users in your tenant.
To share a report:
- Click on the icon to access the report settings.
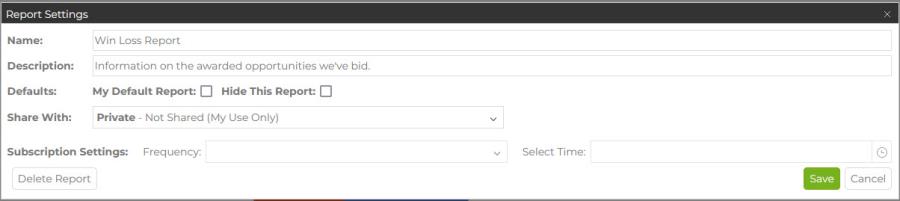
- In the "Share With" section, select your method for sharing.
- Private is the default. These reports are only visible to the creator, and are seen in the "My Reports" section of the report dropdown. Both the shared options will show in the "Shared Reports" section.
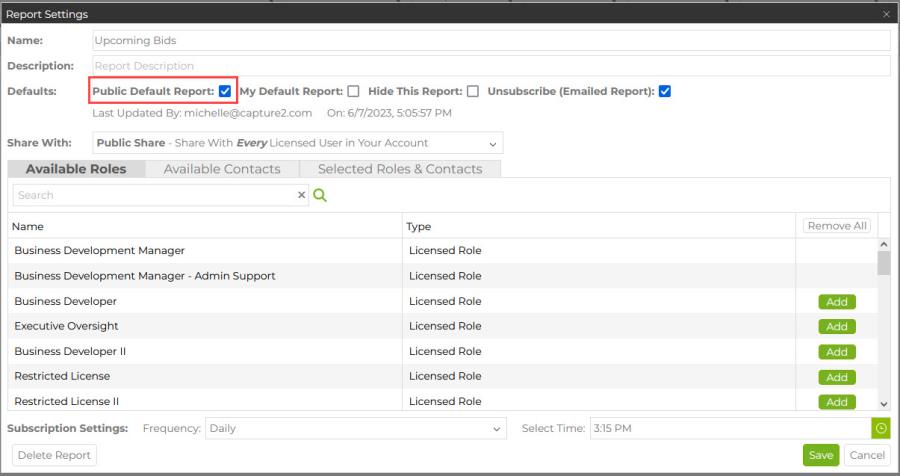
- Public Share is the easy way to share content with all the licensed users in your account. You do not need to select individual roles or users to give them visibility, although you may still select them and change their access type.
- Access types include whether they have manage or view permissions, and whether or not they receive an email* report.
*Email reports are available on the pipeline page only at this time.
- Access types include whether they have manage or view permissions, and whether or not they receive an email* report.
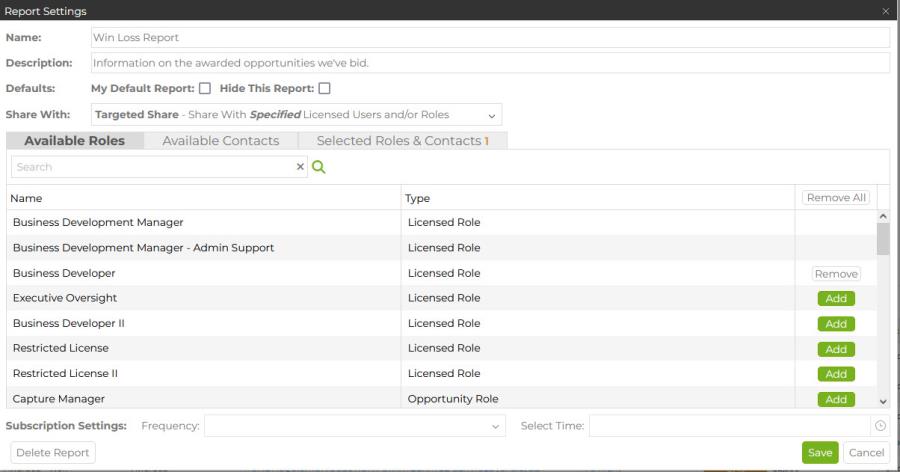
- Targeted Share allows you to select which users and roles will have access to the shared report.
- The default is to give manage-level access to all BD Managers and Admins. This setting cannot be removed on any shared report.
- Any other users or roles must be explicitly invited to receive access.
- The first tab below, "Available Roles" allows you to select a group of users by role.
- All users with the selected roles will automatically have access to the report.
- Removing a user's role will also remove their access to a report if their permission to view it were role-based.
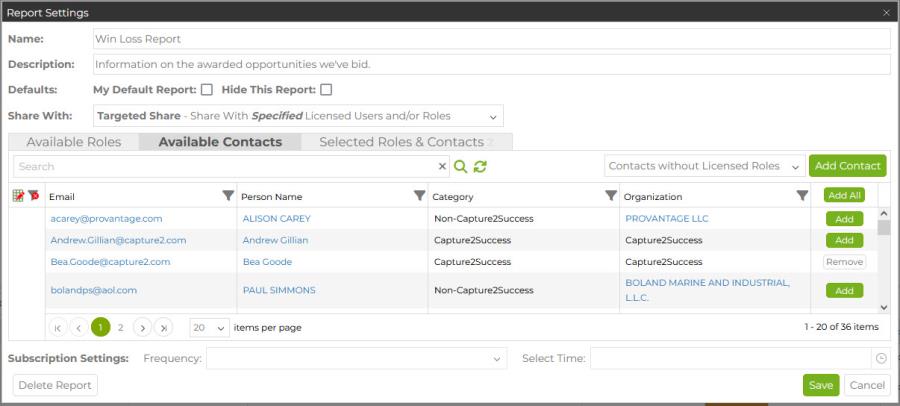
- The second tab, "Available Contacts" allows you to select individual users to allow them access to the report.
- Use the dropdown to select which contact list you'd like to see, or search for an individual user by name or email
- Use the dropdown to select which contact list you'd like to see, or search for an individual user by name or email
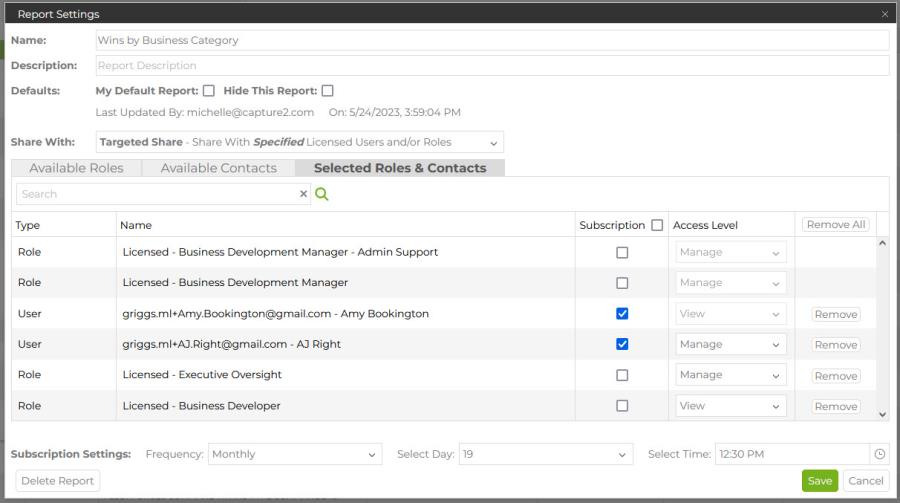
- The third tab, Selected Roles & Contacts, is where you will set the permissions for each user/role added in the initial two tabs.
- Each included row must be given a subscription and/or an access level.
- Subscriptions are only available in Pipeline Reports at the present timem, and only when enabled by your account administrator.
- Unlicensed users who were added to the field will only be allowed be allowed to receive subscriptions.
- Users with Manage level access have full permissions to edit, share, or delete the shared report.
- Users with View lever access will be able to see and access the shared report in the app, but cannot edit any content without saving their edits as a new report.
- Users with No Access in App will not see the report in their shared reports list at all.
- If an email subscription was granted, set the subscription frequency and timing before saving the shared settings.
- You will not be able to save the report until all users and roles in this tab have access to the report; if you choose not to give a user access, you must remove them from the list.
- Each included row must be given a subscription and/or an access level.
A user's view of a shared report within the application will be limited to the opportunities that user can access given their roles. This is an important distinction between reports shared inside the app, and emailed reports. Emailed reports are always based on the full company pipeline (but will exclude any teaming opportunities run by other tenants, or opportunities under Individual Review).
Email subscriptions for reports are a powerful tool for sharing report content with your team on a regular basis. A user with administrative permissions within your account must turn on email report capabilities before your company can create emailed reports. There are a few features of emailed reports that differ from the report view within the app that are important to understand before you enable this function:
- Email reports are not limited to Capture2Proposal users; you can send an email report to anyone you wish.
- An emailed report is always based on the Company Pipeline. It will show all opportunities that meet the report filter criteria in the pipeline. Views will not be limited to the data the user can access within the application.
- This means that everyone who receives the email receives the exact same content. Setting up a report to go out directly before a weekly of monthly pipeline status meeting to all attendees will get everyone on the same page preparing for the meeting.
- Email reports include the pipeline data only; they do not currently include any chart views.
- An email subscription for a report group will send an excel workbook with one worksheet for each report included in the report group.
To enable email subscriptions for reports:
- In the Admin Panel, go to the subscriptions tab. Here you will see the check box to allow subscriptions.
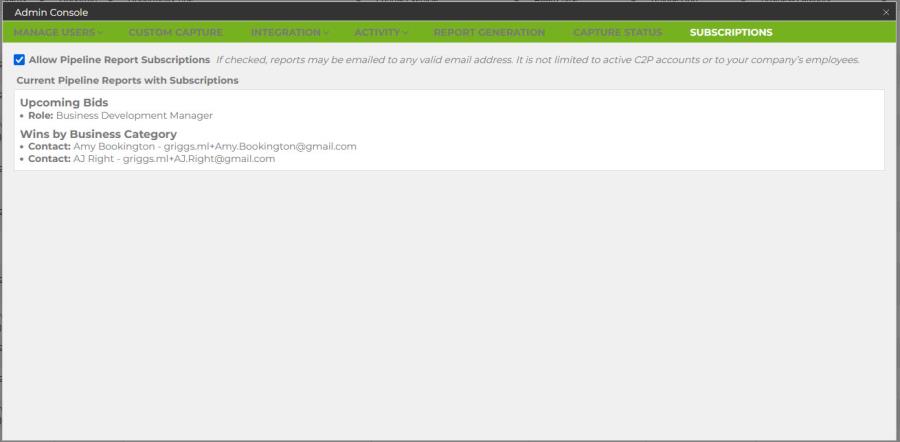
- You will also see a list of any subscriptions that have been set up already. Note that unchecking the box will prevent emails from going out for these subscriptions, however, it will not delete the subscription settings for the report.
- If subscriptions are disabled, users in individual reports will not be able to add or remove users from the subscription, and they will see a message that all tenant subscriptions are currently disabled.
To set up an email subscription within a report:
- You must have edit permissions on the report to set up an email subscription. The report must be shared.
- Go to the settings for the report.
- Make sure that the report is shared in the "Share With" dropdown
- Select either the roles for users who you would like to receive the report, or select individual users by their email or contact information in the first two tabs for contacts.
- In the third tab for the contacts, "Select Roles & Contacts," you will be able to set the Subscription to all selected by checking the box next to the word Subscription in the column header, or by selecting individuals from the list to share with.
- If you have selected a user who does not have adequate permissions in Capture2Proposal to view the report in the application, they will automatically be given an email subscription.
- The line below the contacts pane allows you o select whether the email should be sent daily, weekly, or monthly, and to select the appropriate day and time to send the email.
- Save the report. Users who have been given an email subscription will be notified about the subscription.
To unsubscribe from an email:
There are multiple ways to unsubscribe to an email report if you no longer wish to receive it.
- Use the unsubscribe link in the email.
- Open the report settings in the application and check the box to unsubscribe.
- In your account settings go to the option for email subscriptions and unsubscribe there.
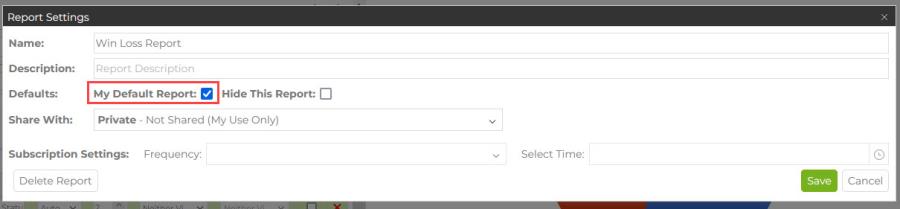
The default report is the one that will open when you initially open the page. Two different defaults can be set - your individual default, or a company default set by an account manager. Your individual default will always trump the company default for your view, but both will be identified in the report dropdown.
Reports in the My Reports and C2P Reports sections can be added as your Default Report, but not as the Company Default. Click the settings gear to open the report settings and check the box to make it your default. If you had a previous default, it will be removed with this action.
Any manager of a shared report will see the option to make the report the public (company) default in the settings section for the shared report. You can set a shared report to be your default report even if it is not the company default.
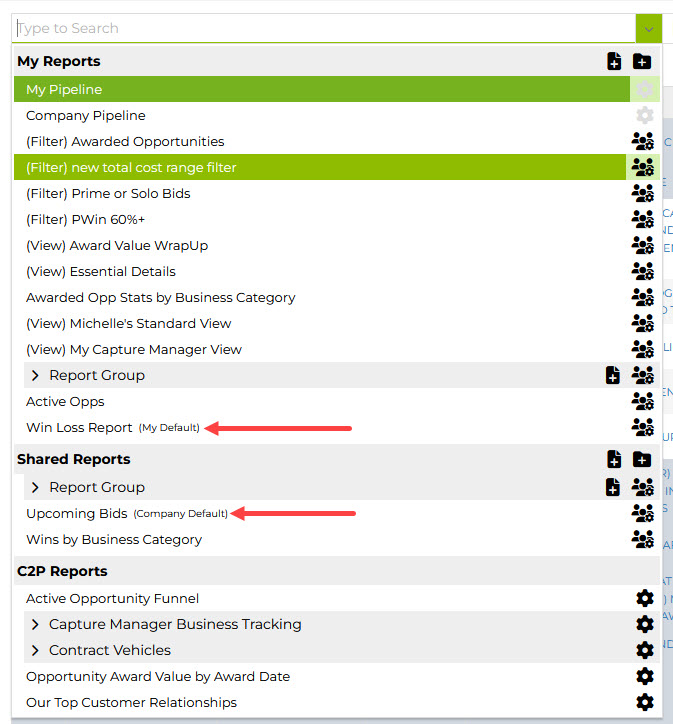
In the drop down, you will see the default indicator next to any defaults in the list, so that you can quickly check which reports are your defaults when making decisions about what to view, or whether to change the default setting.
If no defaults are set at the individual or company level then Company Pipeline will become your default report.
Hidden content is not removed from your report list, but is hidden from the normal drop down list view. This is a great way to hide share reports that you cannot delete, or other content that is not relevant to your day-to-day work right now, but that you would like to keep accessible for later use.]
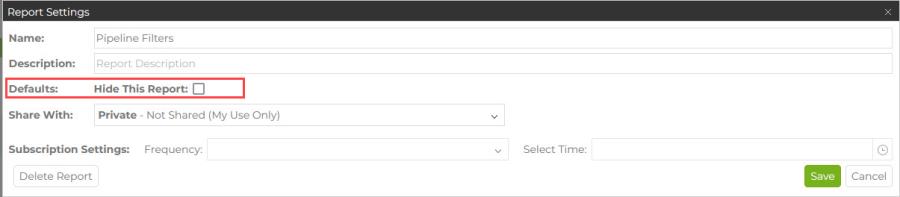
To hide or show a report:
- In the settings menu for the report, look for the check box option to hide the report (or report group).
- Once you click the box, the report will not show in your report drop down. There will be a new eye icon, though, to indicate that you have one or more hidden reports.
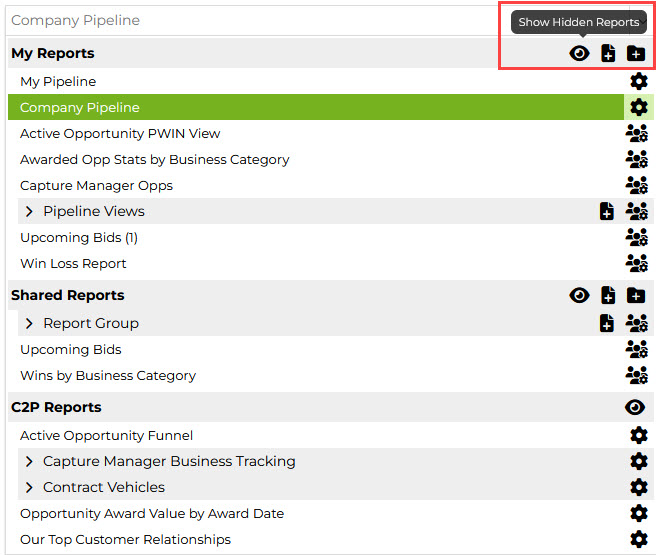
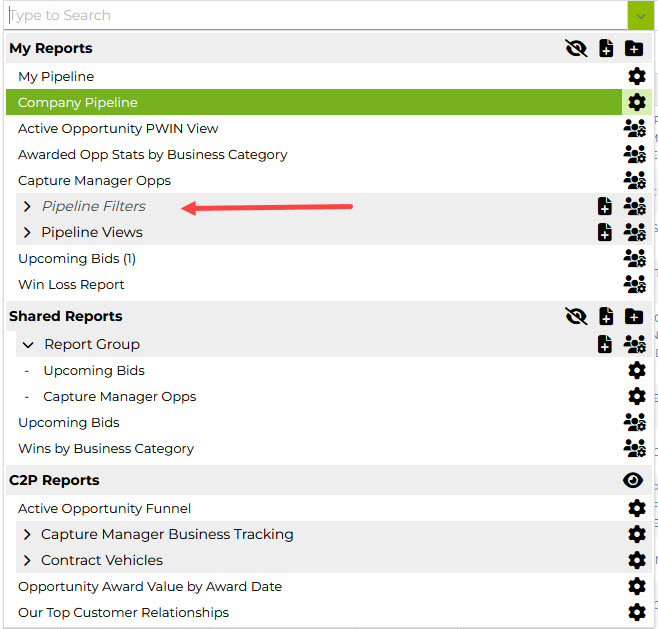
- Clicking the eye will show your hidden reports in that section of the dropdown menu. The text for hidden reports will be lighter than that for your visible reports, and will be italicized.
- Click the report settings icon, then uncheck the hidden report box to make the report visible again.
- Click the eye icon again to hide any other hidden reports from your view.
Report Groups allow you to pull multiple reports together in a single space. This is helpful for grouping reports that fit a single category, such as an analysis of a contract vehicle or a capture status and keeping them all in one place in your report list.
Report groups are managed as a whole, so permissions to view and edit any report within the group is set at the report group level.
To create a report group, click on the file folder/report group icon in the appropriate section of the report selector dropdown. This icon is indicated below in the My Reports section.
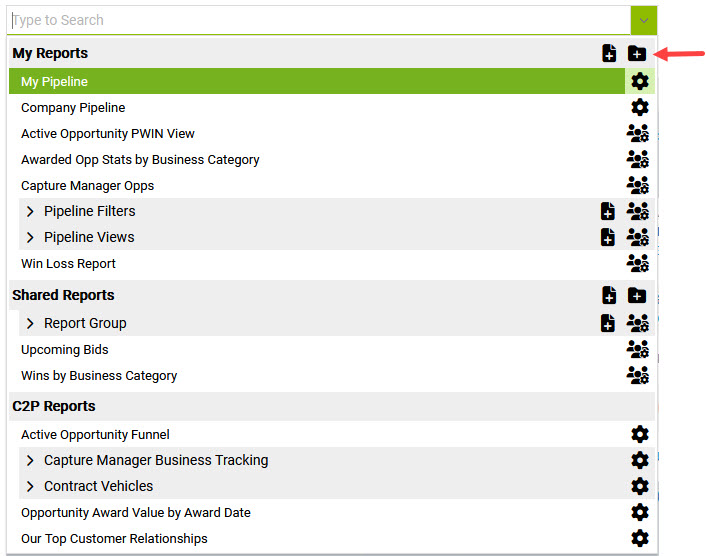
You can then use the report creator icon next to the name of the report group to create a new graph in the report group. Or, you can drag and drop an existing report into the report group.
A user can save a report from a report group outside the grouping by dragging and dropping it to their My Reports menu, or by using "Save As" on the individual report to save it elsewhere.